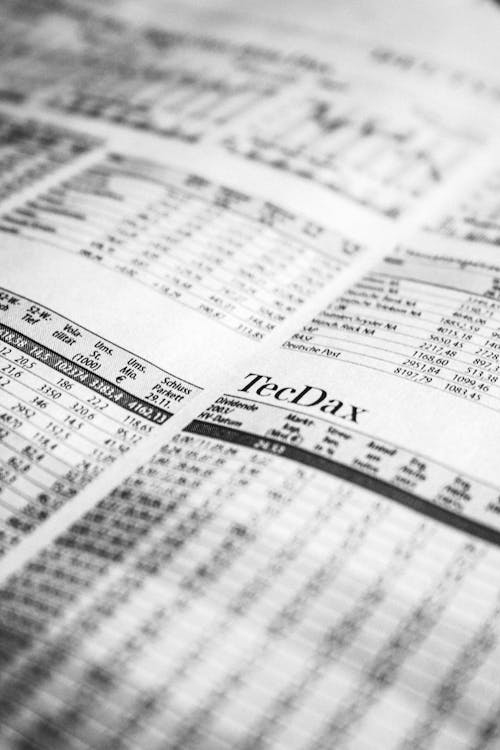
Estimatimating Stock Price Volatility
Volatility is a statistical measure of the dispersion of returns for a given security or market index. It is often measured from either the standard deviation or variance between those returns. In most cases, the higher the volatility, the riskier the security.
In the securities markets, volatility is often associated with big price swings either up or down. For example, when the stock market rises and falls more than 1% over a sustained period of time, it is called a volatile market.
An asset’s volatility is a key factor when pricing options contracts.
Understanding Volatility
Volatility often refers to the amount of uncertainty or risk related to the size of changes in a security’s value.
A higher volatility means that a security’s value can potentially be spread out over a larger range of values. This means that the price of the security can move dramatically over a short time period in either direction. A lower volatility means that a security’s value does not fluctuate dramatically, and tends to be steadier.
One way to measure an asset’s variation is to quantify the daily returns (percent move on a daily basis) of the asset. Historical volatility is based on historical prices and represents the degree of variability in the returns of an asset. This number is without a unit and is expressed as a percentage.
Example
Understanding How to Estimate Stock Price Volatility
Estimating stock price volatility involves measuring how much a stock's price fluctuates over a given period of time. Volatility is an important indicator for investors to assess risk and make informed decisions about their investments. A higher volatility suggests more significant price swings, while lower volatility indicates more stable price movements.
The key concepts in estimating stock price volatility include:
- Historical Volatility: The past fluctuations in a stock's price, typically measured by standard deviation or variance.
- Implied Volatility: The expected future volatility based on options pricing in the market.
- Time Period: The duration over which volatility is measured, such as daily, monthly, or annual volatility.
Steps to Estimate Stock Price Volatility
To estimate stock price volatility, follow these steps:
- Step 1: Collect historical stock price data for the stock you're analyzing. This data can be gathered from financial platforms or stock exchanges.
- Step 2: Calculate the stock's daily price returns. The return is typically calculated as: \( \text{Return} = \frac{\text{Price Today} - \text{Price Yesterday}}{\text{Price Yesterday}} \).
- Step 3: Calculate the standard deviation of the returns over your chosen time period. This represents the historical volatility.
- Step 4: Optionally, use implied volatility data from options markets to estimate future volatility.
Example: If you have collected daily closing prices for a stock over 30 days and calculated the standard deviation of the daily returns as 2%, this would be your stock's volatility for that period.
Factors Affecting Stock Price Volatility
Several factors influence stock price volatility:
- Market Conditions: Economic events, geopolitical tensions, or market sentiment can increase volatility.
- Company News: Earnings reports, product launches, or regulatory changes can influence stock price swings.
- Industry Performance: A stock's volatility might also be impacted by trends or disruptions within its industry.
- Macroeconomic Factors: Interest rates, inflation, and overall economic growth play a role in stock price fluctuations.
Real-life Applications of Estimating Stock Price Volatility
Estimating stock price volatility is critical in several investment scenarios:
- Evaluating risk for individual stock investments or portfolios.
- Setting stop-loss orders or determining appropriate position sizes in trading strategies.
- Pricing options and derivatives, which rely on expected volatility.
Steps in Monitoring Stock Price Volatility
Once you estimate stock price volatility, it’s important to track it regularly:
- Review daily, weekly, or monthly volatility to spot trends in the stock’s price movements.
- Adjust your investment strategy based on changes in volatility. For example, you may want to reduce exposure to highly volatile stocks.
- Use volatility indexes or financial tools to get a broader view of market volatility and its potential impact on your investments.
| Calculation Type | Description | Steps to Calculate | Example |
|---|---|---|---|
| Historical Volatility | Calculates the historical volatility of a stock based on past price fluctuations. |
|
If you have stock price data for 30 days, and the standard deviation of the daily returns is 2%:
|
| Implied Volatility | Calculates the expected future volatility based on options pricing. |
|
If the option's market price is $5, the strike price is $50, and the stock price is $52 with 30 days to expiration:
|
| Annualized Volatility | Converts daily volatility to annual volatility to get a clearer picture of long-term risk. |
|
If the daily volatility is 2%, then the annualized volatility is:
|
| Volatility After News Event | Estimates how volatility changes after a significant news event or market announcement. |
|
If a major earnings report causes a 5% price drop, and volatility increases to 10% for the following month:
|


